The X•Y Chart
“Plotting products is plotting points”
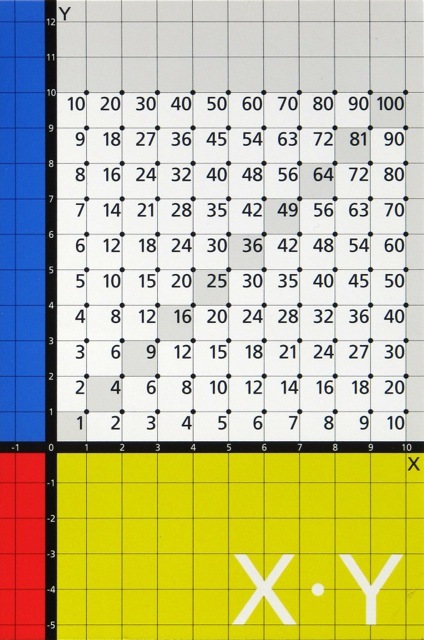
What is The X•Y Chart?
The X•Y Chart is a visual multiplication and coordinate map. It helps students and teachers move from number facts to points, patterns, and graph thinking.
Einstein and Freud
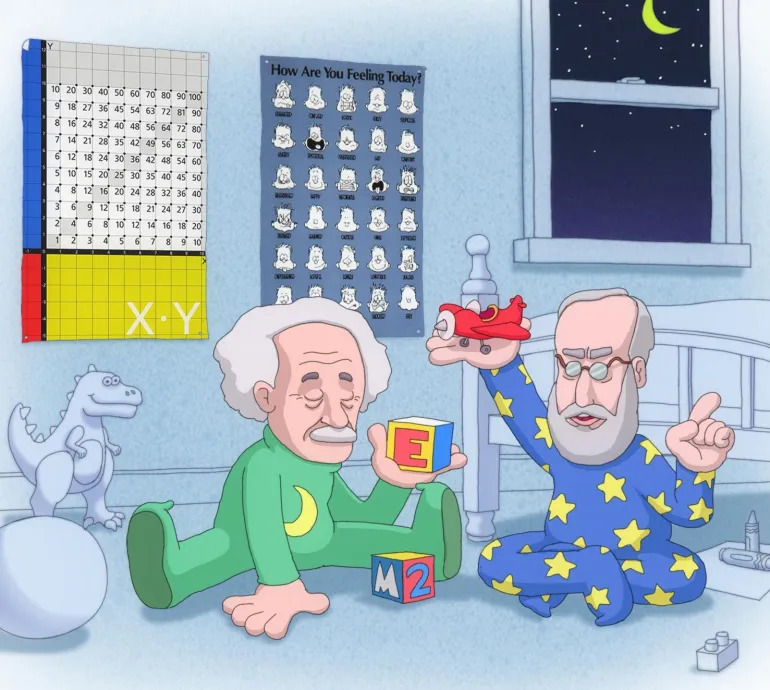
The X•Y Chart Ad
User Guide
Guide is available here and on the Order page.