Seeing the numbers
This is for parents who may wonder what’s the big deal about the Cartesian coordinate system and why should my child become familiar with it. The quick answer is that it is the primary visual tool of mathematics. It helps visualize how numbers change when subjected to the same operation. For example, keeping with our customary use of x and y to represent numbers, one may ask: What does y = x2 look like for all numbers, not just for x = 3, for example. The relationship between x and the y that results when x is squared looks like this red line:
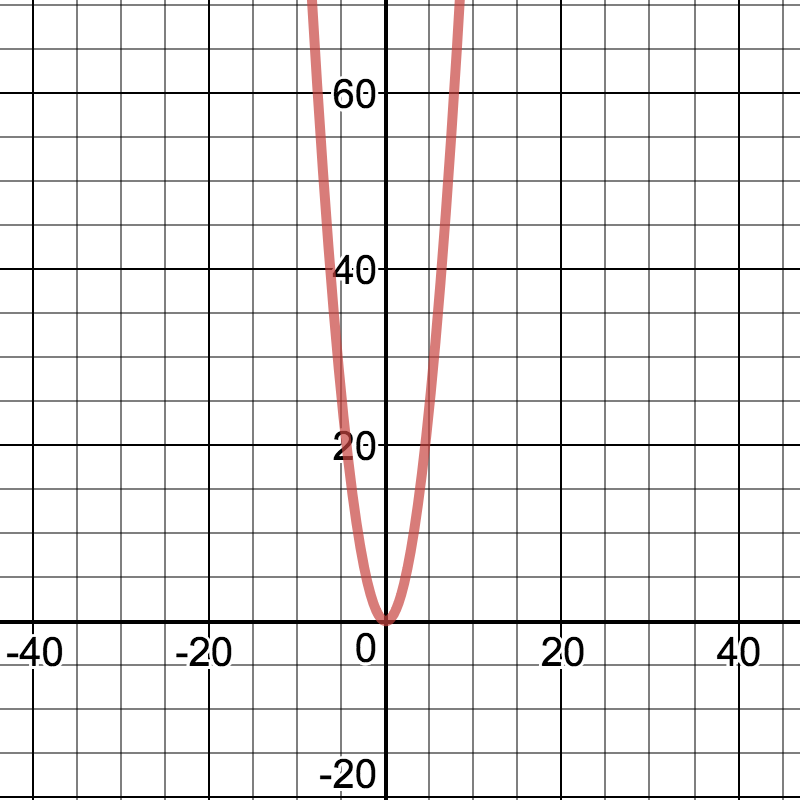
This figure called a parabola tells all. Other alternatives such as a list of resulting (x,y) number pairs
(3,9), (4,16), (-2,4), (5,25), (-10,100), (6,36) or the popular xy table:
| X | Y |
| -5 | 25 |
| 10 | 100 |
| -3 | 9 |
| 11 | 121 |
| -6 | 36 |
| 0 | 0 |
| 1 | 1 |
| -4 | 16 |
| 7 | 49 |
| 4 | 16 |
| 15 | 225 |
We can later explore how to use the graph, but for now recognize that if a range of x values starting with negative numbers and proceeding to positive numbers is multiplied by itself, those pairs of x’s and y’s when plotted as points will produce a figure that goes down and back up in symmetrical fashion. That’s easier to see with the graph.
Here is a great online graphing calculator if you’d like to experiment. Enter y = x^2 in the input field to see this parabola.